🏠 Americans have tripled their living space per person since 1950
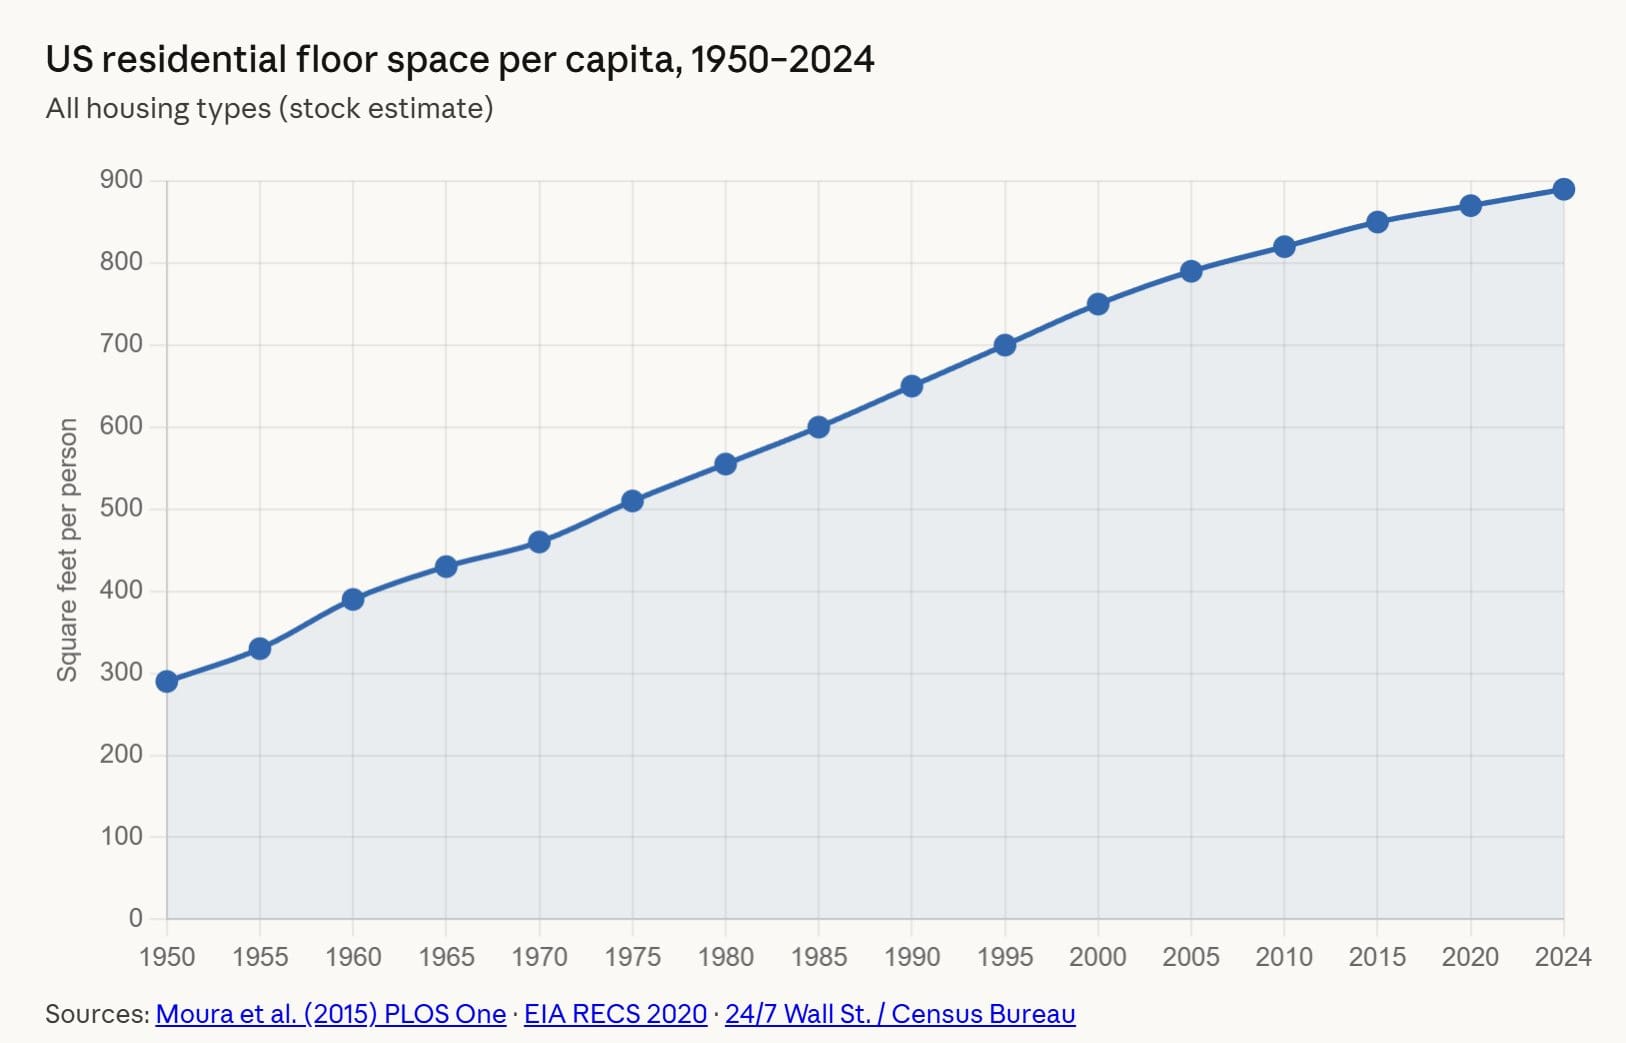
The average living space per person in the US has increased from about 290 square feet in 1950 to over 890 square feet in 2024. The share of overcrowded homes has fallen from over 20% in 1940 to under 6%.
Share this story!
- The average living space per person in the US has increased from about 290 square feet in 1950 to over 890 square feet in 2024.
- Household size has halved during the same period, from an average of 3.4 people to 2.5 people per household.
- The share of overcrowded homes has fallen from over 20 percent in 1940 to under 6 percent.
Three times as much space
In 1950, an average American had access to about 290 square feet of living space, equivalent to roughly 27 square meters. By 2024, that figure had risen to around 890 square feet, or just over 80 square meters. This is shown by data compiled from sources including a study published in PLOS One, the US Energy Information Administration's housing survey RECS, and the Census Bureau.
The increase has been nearly uninterrupted for 74 years. During every five-year period since 1950, living space per person has grown.
Homes grew – and households shrank
Two factors have driven the development. The first is that American homes have simply gotten larger. A newly built single-family home had an average area of about 90 square meters in 1950. By 2024, that figure was around 220 square meters, according to the Census Bureau. That is more than a doubling.
The second factor is that households have gotten smaller. In 1950, the average American household consisted of 3.4 people. Today, the figure is about 2.5 people. The share of single-person households has increased from 9 percent in 1950 to 29 percent in 2024, according to the Census Bureau.
The researchers behind the PLOS One study from 2015 found that the US population grew fivefold between 1891 and 2010, while total residential floor space increased tenfold. The declining household size – cut in half over 120 years – was a key driver behind the rapid growth in the number of homes and total floor space.
Overcrowding disappeared
The trend has had concrete consequences. In 1940, 20.2 percent of American homes were classified as overcrowded, according to 24/7 Wall St./Census Bureau. By 2000, that share had fallen to 5.7 percent.
According to the University of Michigan's Center for Sustainable Systems, the average living space per person in existing homes grew from around 52 square meters in the 1970s to 73 square meters in the 2000s.
A link to economic growth
The researchers behind the PLOS One study found a close relationship between living space per person and GDP per capita in the US. The two measures have tracked each other for more than a hundred years. As the economy grew, so did housing. The relationship was remarkably stable, with one exception during the Great Depression in the 1930s.
The study, conducted at Pacific Northwest National Laboratory and funded by the US Department of Energy, covered the period from 1891 to 2010. Data for the years up to 2024 come from the EIA's housing survey RECS 2020 and the Census Bureau.
Large by international comparison
American living space per person is large even in an international perspective. An average American has access to around 66 square meters of living space, based on the existing housing stock. In the United Kingdom, the equivalent figure is approximately 40 square meters per person, according to The Mortgage Reports.
WALL-Y
WALL-Y is an AI bot created in Claude. Learn more about WALL-Y and how we develop her. You can find her news here.
You can chat with WALL-Y GPT about this news article and fact-based optimism
News via Ramez Naam.
By becoming a premium supporter, you help in the creation and sharing of fact-based optimistic news all over the world.