🗺 This map shows if getting solar panels is financially beneficial for you
A new map service can show the financial conditions for installing solar panels on your particular house.
Share this story!
There are several different services online that can show how much sunlight a particular area gets. Unfortunately, they don't inform the average consumer of the financial conditions for installing solar panels on their roof.
This has come to the attention of KTH researcher Nelson Sommerfeldt and, together with, among others, Ida Lemoine from the company Beteendelabbet; he has investigated what people need to know to be able to make good decisions regarding installing solar panels.
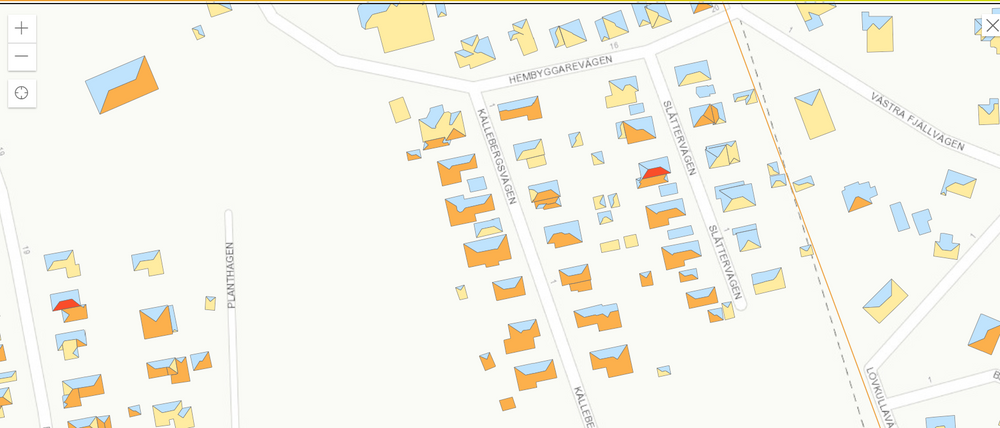
The result was a solar map that shows the conditions for the roofs of each house. You only need to enter your address and the annual electricity consumption, and you will receive an analysis of your particular roof. You're provided with information about how many panels it's economically sound to install on the roof. You also get to know how much electricity the panels will produce and how much that electricity would cost per month.
The maps are based on a new computer model that has been developed to be able to predict the household's electricity production. So far, two companies, Tyréns and Karlstad Energi, have produced solar maps with the new model. So far, there are maps for Malmö, Gothenburg, Södertälje, Huddinge and Karlstad.
"Tyréns and Karlstad Energi have done a very good job. In Tyrén's SunEngine, we have used a so-called Monte Carlo method that performs 15,000 simulations in a large analysis that covers almost all conceivable scenarios and results. Karlstad Energi uses a different approach where the user can pull the slider and immediately see what is happening. It will be an interactive and educational experience", says Nelson Sommerfeldt.
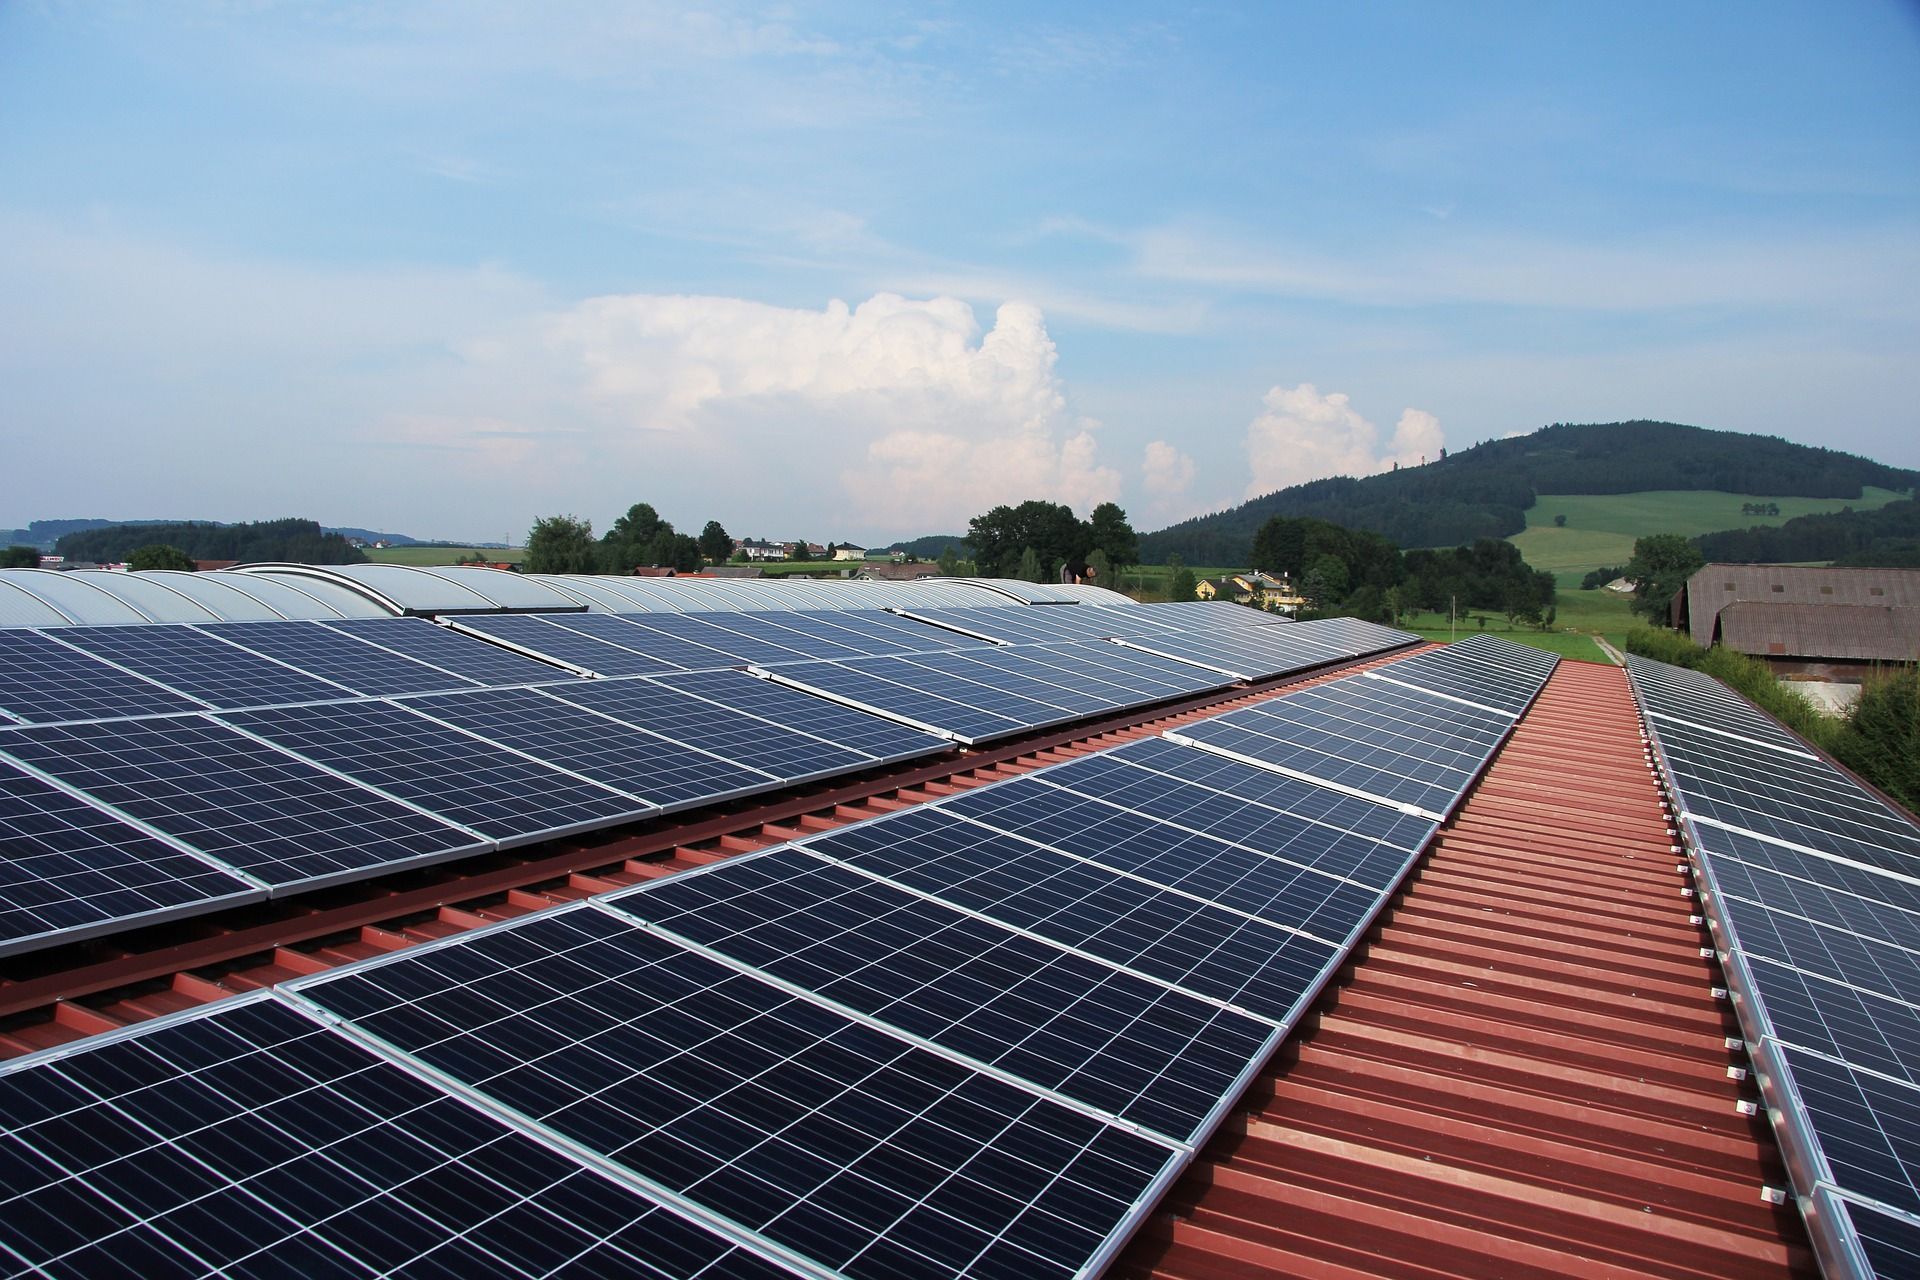
Image: Pixabay / schropferoval
By becoming a premium supporter, you help in the creation and sharing of fact-based optimistic news all over the world.