
🏭 24 of 26 air pollutants have decreased in Sweden
PART 2: Of the 26 air pollutants that the Swedish Environmental Protection Agency measures, 24 have decreased in absolute numbers during the period 1990–2018. At the same time, Sweden's population increased by roughly 1.6 million and the economy almost doubled.
Share this story!
Air pollution is exhaust gases and particles that occur in harmfully high concentrations, usually due to human activity. The negative health effects of air pollution became particularly evident after hundreds, in some cases thousands, of people died as a direct consequence of smog in the 19th and the first half of the 20th century. One of the most noted cases is 1952's "The great smog of London", which is estimated to have caused up to 12,000 deaths.
In 2020, around 90 percent of the world's population breathed polluted air. According to the WHO, air pollution is one of the biggest global health challenges of the coming decade. Awareness of air pollution's damage to people has increased as the long-term health effects of air pollution have become increasingly apparent around the world. But how does it look in Sweden?
Of the 26 Swedish air pollutants that the Swedish Environmental Protection Agency measures, 24 have decreased in absolute numbers during the period 1990–2018, while Selenium and PCBs increased. In several cases, it has been a matter of sharp reductions in emissions, for example reduced emissions of lead into the air by 97 percent. Emissions decreased at the same time as Sweden's population increased by roughly 1.6 million and the economy almost doubled.
Reduced by 52 percent
On average, these 26 emissions have decreased by 52 percent since 1990. The high-performing group includes Lead (-97 percent), Arsenic (-86 percent), Sulfur oxide and HCB (-83 percent). After that comes an intermediate layer with several reductions in the range of 70 to 80 percent such as Nickel (-75 percent), Mercury and Chromium (-74 percent). The majority is found around -50 to -65 percent. Then there is a smaller group where the reduction was below 50 percent. Related to per GDP unit, the decrease was even greater as GDP almost doubled during this time period, as seen in the table below.
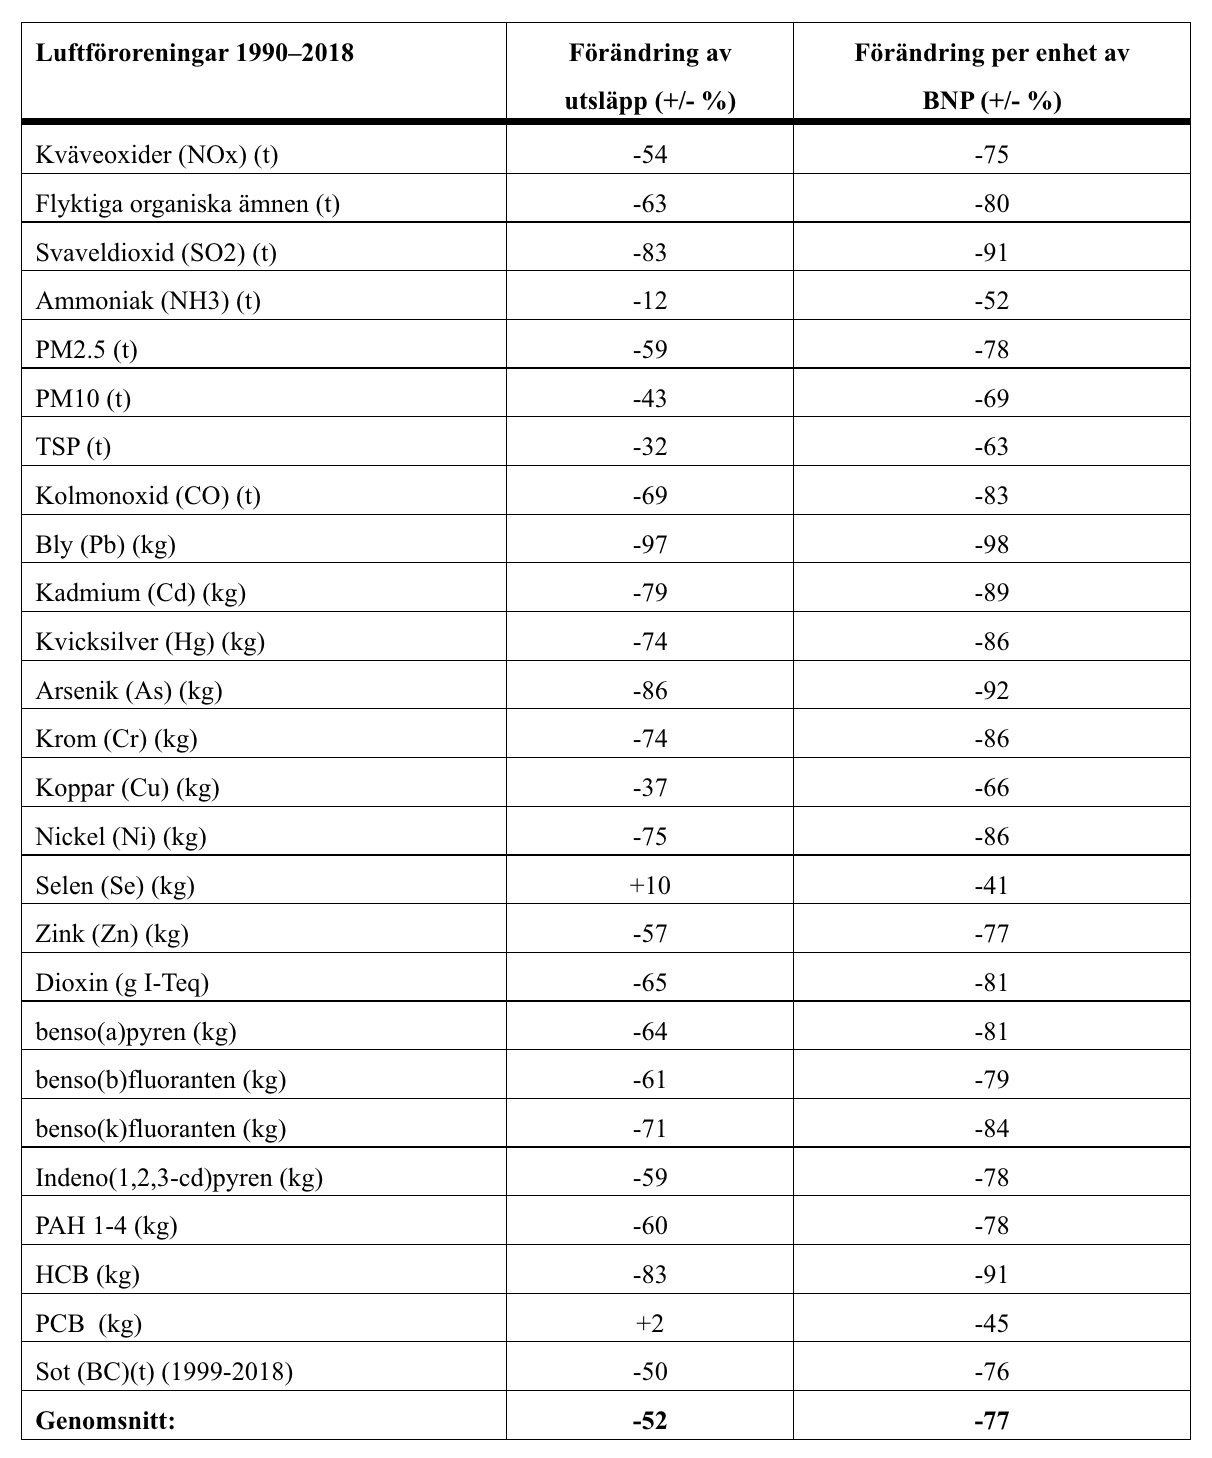
Table 3. Air pollution emissions 1990–2018. Emissions are given as a percentage of 1990 levels. In the column on the far right, the emissions have been put in relation to the increase in GDP of 85 percent that took place during this time. Source: The Swedish Environmental Protection Agency (Taken from the Statistics Norway statistics database).
Why have emissions decreased?
How did it happen that emissions decreased? The reduction in emissions of volatile organic compounds, carbon monoxide and nitrogen oxides over the past 30 years comes from the transport sector. Catalytic exhaust gas treatment is the biggest explanatory factor. Catalytic converters for passenger cars were first introduced in the United States in 1975 due to the 1970 Clean Air Act with requirements to reduce emissions of toxic substances from internal combustion engines. Over the years, the regulation of emissions has been tightened, which has resulted in more efficient exhaust gas treatment.
Between 1990 and 2018, the reduction in emissions of metals, particulates, persistent organic compounds (e.g. dioxins) and polycyclic aromatic hydrocarbons (PAHs) has mainly occurred in the industrial sector through efficiency improvements and better purification equipment such as electro-filters and scrubbers.
The industry performs best
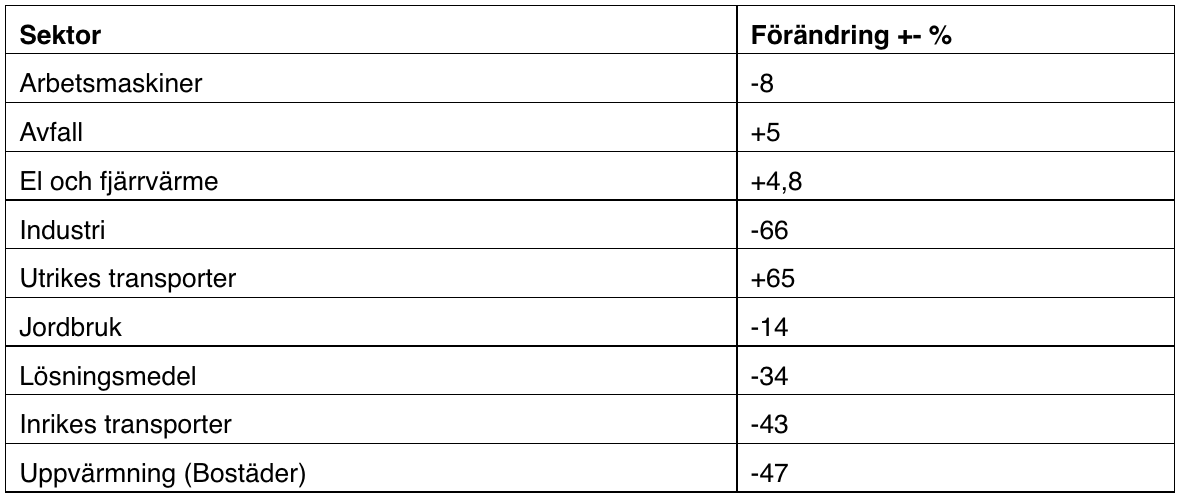
There are large differences between different sectors regarding the emissions of these 26 air pollutants, industry has performed best with emission reductions of 66 percent, followed by Heating (-47 %), Domestic transport (-43 %), Solvents (-43 %) and Agriculture ( -14 %). Electric and district heating, Waste and Work machines are largely unchanged. Foreign transport is the only category that has seen a clear increase in its emissions (+66%).
The development is often attributed to stricter limit values for emission standards and the application of best available technology. The IPPC directive (Integrated Pollution Prevention and Control), which was adopted by the EU in 1996, meant that emission limit values would be based on best available techniques (BAT - Best Available Techniques). The principle means that the most effective established technology to protect the environment and which is at the same time technically and economically applicable must be used. The EU draws up so-called BAT conclusions, which specifically reflect the current best available technology.
Political measures have paved the way
Political measures such as taxes, subsidies and, in the next stage, outright bans seem to have paved the way for Sweden's environmental successes and made it rational for economic actors to both conserve resources and develop new technology.
Sweden has reduced the vast majority of air pollution emissions over the past 30 years. Some emissions have decreased only marginally, such as ammonia, while some have decreased by up to 97 percent, such as lead.
At the same time, Sweden's economy has almost doubled and the population has increased by roughly 1.6 million since 1990, which means that we get more out of less.
Although much remains to be done, the results are encouraging. More for less appears to be possible through a combination of streamlining, new technology, taxes and legislation.
Jonas Grafström, researcher and deputy CEO at Ratio
Christian Sandström, assistant professor at Ratio and Jönköping International Business School
The basis and figures are available in the book Mer för mindre? – tillväxt och hållbarhet i Sverige. Read more about the book here (Swedish).
 Jonas Grafström
By becoming a premium supporter, you help in the creation and sharing of fact-based optimistic news all over the world.