Sweden and Swedish Companies From an International Perspective
Share this story!

Between 1990 and 2017, Sweden reduced greenhouse gas emissions by 26 percent. During the same period, Sweden’s GDP per capita increased by over 50 percent and went from being 8.6 to 10.1 million inhabitants. The total greenhouse gas emissions in 2017 were 52.7 million tons of carbon dioxide equivalent, which is about 0.1 percent of global emissions.
In terms of the official measure, territorial emissions, Sweden is a leading country. We are one of the few nations that reduce our per capita emissions while increasing economic prosperity. Carbon dioxide emissions per Swedish and year are 4.5 tons, which is significantly lower than the OECD and the EU average (EU-28) of 6.8 tons and slightly lower than the world average of 4.8 tons.
Sweden’s greenhouse gas emissions are thus among the lowest in the EU and the OECD, regardless of whether we count emissions per person or emissions as a percentage of GDP. This is mainly because Sweden has significantly reduced the proportion of fossil fuels in the energy system since the 1970s. The large proportion of electricity use, especially in the basic industry, has contributed to low emissions in many sectors, as electricity production is based on hydro and nuclear power that do not give rise to direct carbon dioxide emissions. This also means that the Swedish export industry is one of the most environmentally friendly in the world with comparatively very low greenhouse gas emissions.
Emissions divided by social sectors
If we divide greenhouse gas emissions by social sector, we see that industry and domestic transport are the largest sources of emissions. In total, they release about 17 million tons each. In domestic transport, road traffic accounts for the largest part, about 93 percent. Emissions from domestic transport were three percent lower in 2017 compared to 2016 but increased slightly in 2018.
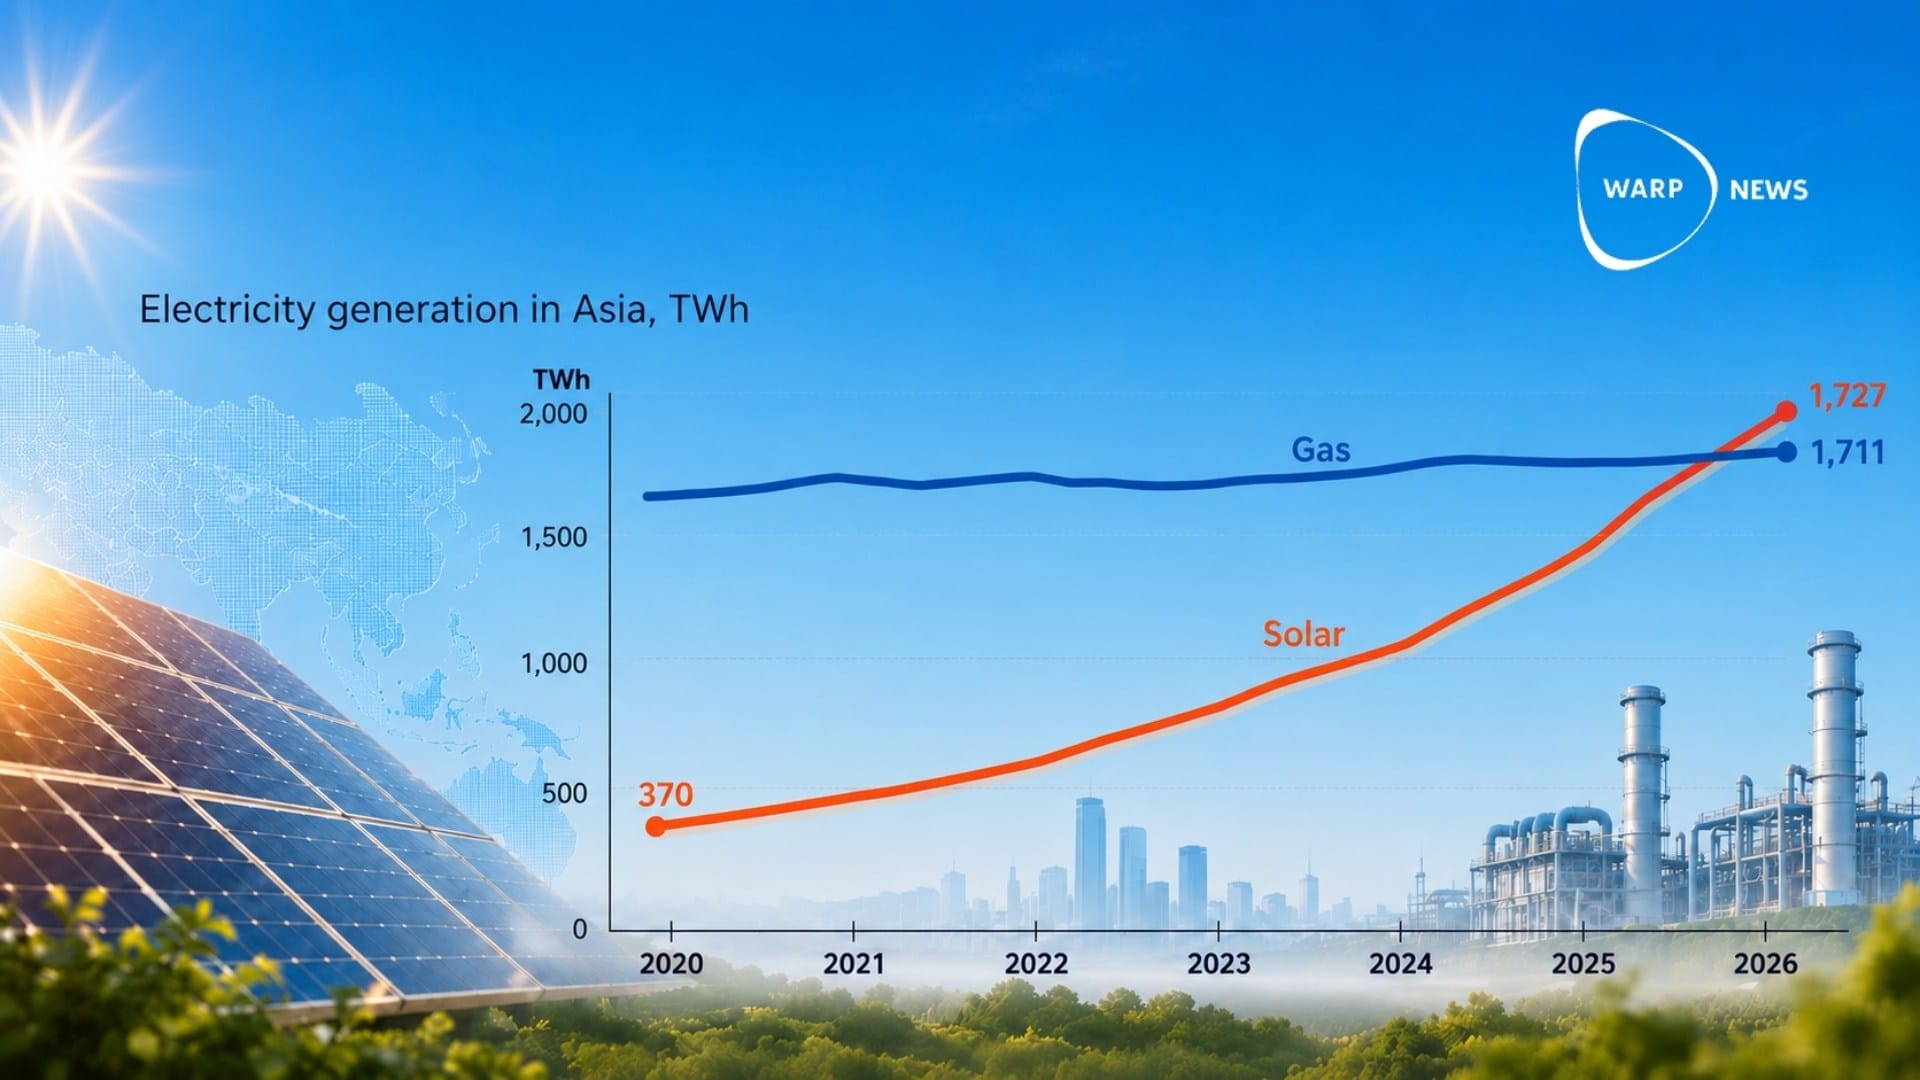
Greenhouse gas emissions from Sweden’s electricity and heat production are relatively small, which sets us apart from most other countries. The reason for this is that Swedish electricity is produced almost exclusively with hydropower and nuclear power, but an increasing part is also produced with wind power and biofuel. Even today, district heating is almost completely free of fossil fuels. Today, district heating production is instead dominated almost exclusively by waste, biofuels, waste heat and heat pumps. In our surroundings, on the other hand, it is very common for electricity and heat production to be based on fossil fuels.
Globally, deforestation is a very important source of greenhouse gas emissions. Deforestation that occurs without responsible forest management with reforestation reduces the vegetation’s ability to absorb carbon dioxide. But in Sweden, it is the opposite. Instead of being a source of emissions, Swedish forestry and land use (LULUCF) capture huge amounts of carbon dioxide.
Sweden – one of the world’s most sustainable countries
In 2016, Sweden was one of the OECD countries that emitted at least carbon dioxide per produced value. Only Switzerland had a lower carbon dioxide intensity. Since 1970, Sweden’s production has become six times more efficient.
In 2016, Sweden stood at 0.10 kg CO2 / 2011 PPP USD. The corresponding number of kilos for Switzerland was 0.08 while the EU-28 average was 0.19 and in the world 0.32.
Again, the main contributing factor is that Swedish electricity generation has a low proportion of fossil fuels. A high proportion of fossil-free electricity, mainly hydropower and nuclear power, means that in Sweden we can have an energy-intensive industry while maintaining a low carbon dioxide intensity. An evaluation conducted in 2019 by the International Energy Agency (IEA) shows that Sweden is a leader in the transformation of the energy system.
According to the international index CCPI, or the Climate Change Performance Index , which takes into account, among other things, a country’s aggregate results in greenhouse gas emissions, the share of renewable energy, energy use, and climate policy, Sweden is the best in the world in 2019.
According to EPI, the Environmental Performance Index , which is a weighting of a number of environmental criteria established for all countries, Sweden is sixth-best in the world out of a total of 180 countries. Best in this index is Switzerland, followed by France, Denmark, and Malta.
Sweden is also in the top of the world, among OECD countries, in terms of recycling. In 2017, the Swedish market was supplied with 1.3 million tons of packaging for different types of goods and just over 70 percent, or 942,100 tons, were submitted for material recycling. We are best at recycling glass and metal. What is not recycled is incinerated and used for district heating. Landfills are scarce in all of Sweden.
The Global Energy Architecture Performance Index 2016 compares energy systems in the world’s countries and ranks them according to three factors:
- Economic growth and development – the extent to which a country’s energy architecture contributes to or reduces economic growth
- Environmental sustainability – impact on the environment from energy production and consumption
- Energy supply and security – the extent to which energy supply is safe, accessible and diversified
According to this index, Sweden is the best in the EU and third-best in the world. Number One is Switzerland followed by Norway.
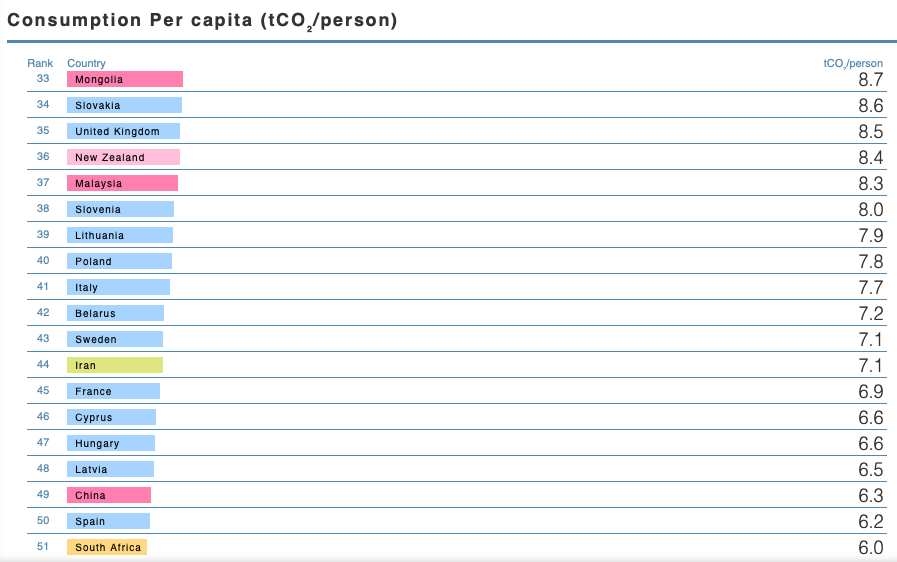
Global Carbon Project compilation Carbon Atlas shows data for greenhouse gas emissions. In their accounts, Sweden is ranked 43rd in the world over the countries that emit the most per capita consumption-based emissions. On average, the Swedish emitted 7.1 tons of carbon dioxide per person in 2016, which is the most recent time series available. Luxembourg has the highest consumption-based emissions per capita, with 41 tons per year. Two are Qatar with 33 tons followed by the United Arab Emirates with 27 tons.
Global Footprint Network’s ranking from 2016 shows that Sweden is in 16th place among the countries with the largest ecological footprint. According to this calculation and ranking, the available biocapacity per person on the planet is 1.7 global hectares and every Swede currently uses 6.5 hectares. Worst on the list is Qatar with 14.4 followed by Luxembourg with 12.9. However, with regard to Sweden as a nation, we have a reserve of 3.1 global hectares, as we are few inhabitants given the nation’s landmass and large forests, which gives us a biocapacity of 9.6 global hectares per person.
In summary, virtually all measurements and various types of indexes that Sweden, as a developed welfare country, shows that we are leading in terms of sustainability and the environment from an international perspective.
Three ways to measure emissions
Greenhouse gas emissions can be measured in three different ways.
Territorial emissions – the main measure
Territorial emissions are the main and official measure for measuring greenhouse gas emissions and are used to follow up the climate targets set for Sweden within the UN, EU and nationally. Thus, territorial emissions are always what is stated unless otherwise stated.
Emissions are calculated “bottom-up”, which means that detailed statistics for emissions-driven activities are measured and calculated. For example, the number of animals is counted, which is the basis for calculating agricultural emissions. In industry, energy use is measured and used to calculate its climate impact.
The advantages of the territorial statistics are that it is well suited for evaluating national development and goal achievement. A reduction in emissions in the Swedish export industry will reduce national emissions and is reflected in the statistics. In addition, there is significantly better access to international data compared to other measures.
Production-based emissions – a complementary measure
Production-based emissions are a complementary measure to the territorial emissions and are similar to the territorial emissions in terms of emissions estimates within Sweden’s borders.
In addition, there are emissions from international transport, which gives an estimate of the emissions caused by Swedish companies and persons abroad. Over time, the development of the two measures is strongly correlated, but the production-based emissions are at a slightly higher level than the territorial ones. The strengths and weaknesses are similar to the territorial method.
Consumption-based emissions – a third complementary measure
Consumption-based emissions are another complementary measure to the territorial emissions.
Data from the national accounts are used in input-output models to calculate the total emissions from our domestic final use. It includes consumption by households and the public sector as well as investments.
Greenhouse gas emissions from Swedish consumption have remained unchanged in recent years. Emissions within Sweden’s borders have decreased somewhat, while emissions in other countries have increased to about the same extent, according to the Economy Facts . Greenhouse gas emissions are highest in Russia, followed by China and Germany.
The advantage of this measure is that it gives an indication of the number of emissions generated in the production of goods imported for final consumption. It is also possible to see in which countries the emissions occur.
A significant disadvantage of the measure, especially for a country like Sweden with an energy system with very low climate impact, is that the climate benefit that the Swedish export industry contributes does not appear in the statistics. In addition, the calculation methods are currently far more uncertain than the territories and the availability of comparable statistics for other countries is weak.
PRINCE – Sweden’s measure of consumption-based emissions
The figures presented by the Swedish Environmental Protection Agency in terms of consumption-based emissions come from a research project called PRINCE , which stands for “Policy-Relevant Indicators for National Consumption and Environment”.
According to the method of measurement reported according to this method , the consumption-based emissions per Swedish and the year were 10.11 tons in 2016 .
PRINCE is an ambitious project that includes many factors that affect Sweden’s emissions, both nationally and abroad. But there are no international comparisons. Data for PRINCE is available only for Sweden, which means that the measure cannot be compared with any other countries. Thus, whether 10.11 tons is comparatively much or little cannot be investigated.
The PRINCE website states, translated from English, that:
“Since the results of PRINCE are the first indications produced for Sweden with these methodologies, much work remains to be understood and interpreted and to identify what they mean for policies.”
“Much of the work with PRINCE was experimental. This means that some of the new indicators, while promising, require further research and refinement before they are mature enough to be included in national sustainability measures. “
With this in mind, the dimensions are reported on the Swedish Environmental Protection Agency’s website and in a variety of other contexts. For example, the Energy and Climate Advisory Council uses these figures in “Calculation of your climate impact”: “The average Swedish greenhouse gas emissions are 10 tonnes per year. A sustainable level 2050 is 1-2 tonnes per person per year.”
In summary, consumption-based measures are an important complement, but should be used as just a third supplementary measure. The data is uncertain, which the Swedish Environmental Protection Agency writes itself on its website:
“Consumption-based emissions are therefore considered to have a higher degree of uncertainty than the calculation of emissions occurring within Sweden’s borders.”
Sweden uniquely positioned
Sweden is uniquely positioned with leading technology in several areas of green technology.
As the focus on climate change has increased, people have become increasingly environmentally conscious, which is changing our way of consuming and transporting us, but the transition is still far too slow.
We are moving into new market logic where sustainability is about to be disruptive for the first time. This is the first time that consumers and businesses are aware of the consequences of climate change. According to the researchers’ forecasts, this will become more and more evident. This leads to an exponential demand for sustainable products and services. Changes in demand follow a changed supply. The exponential technological development means that we can develop solutions faster and faster in response to this demand.
Companies that have a major impact on the UN’s sustainability goals will have stronger value development in the long run. It is no longer a question of whether companies and organizations should change or not, but how quickly they can change.
By becoming a premium supporter, you help in the creation and sharing of fact-based optimistic news all over the world.