
Climate Change
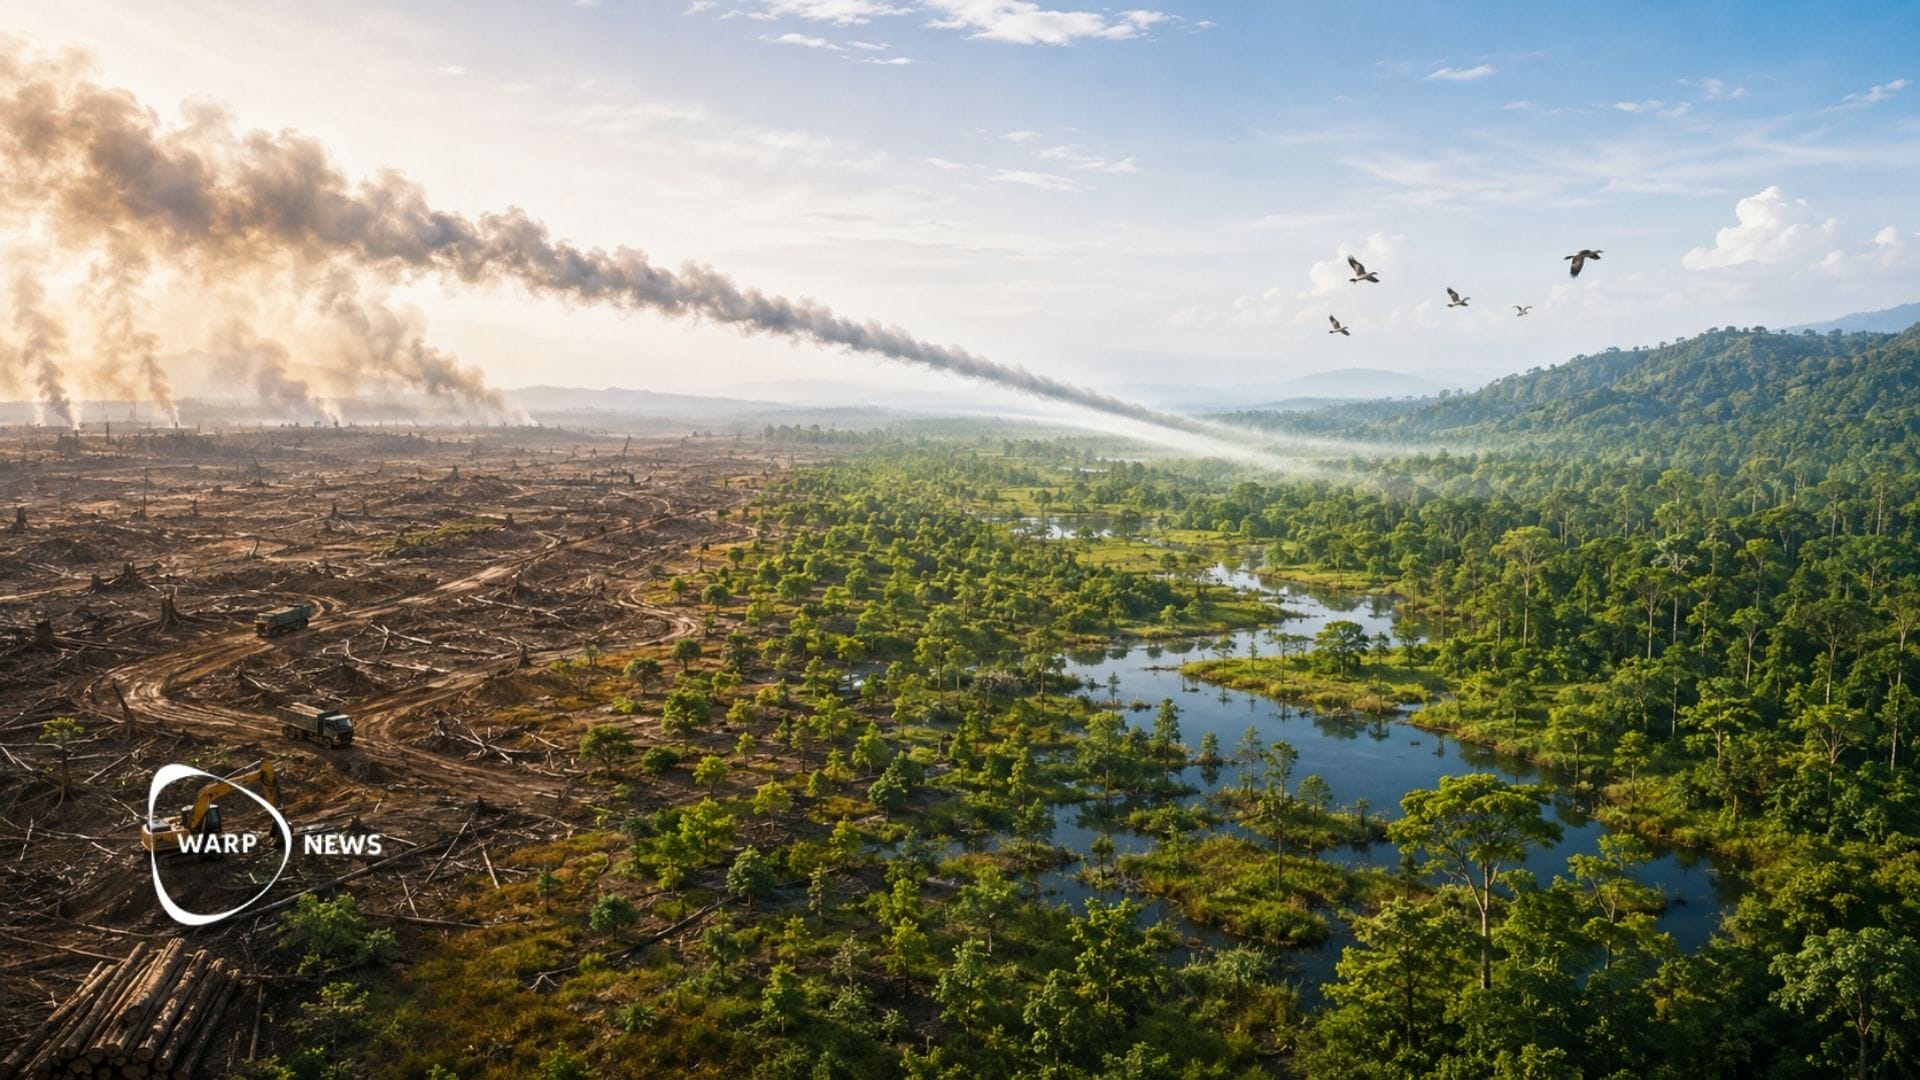
📉 Emissions from deforestation and land use have fallen 32 percent since the 2000s
Until 1999, emissions held steady at around 6.6 billion tonnes of carbon dioxide per year. Between 2015 and 2024 they averaged 5 billion tonnes, and in 2025 they fell to 4.1 billion tonnes. The main reasons are that permanent deforestation has decreased and that new forest absorbs carbon dioxide.
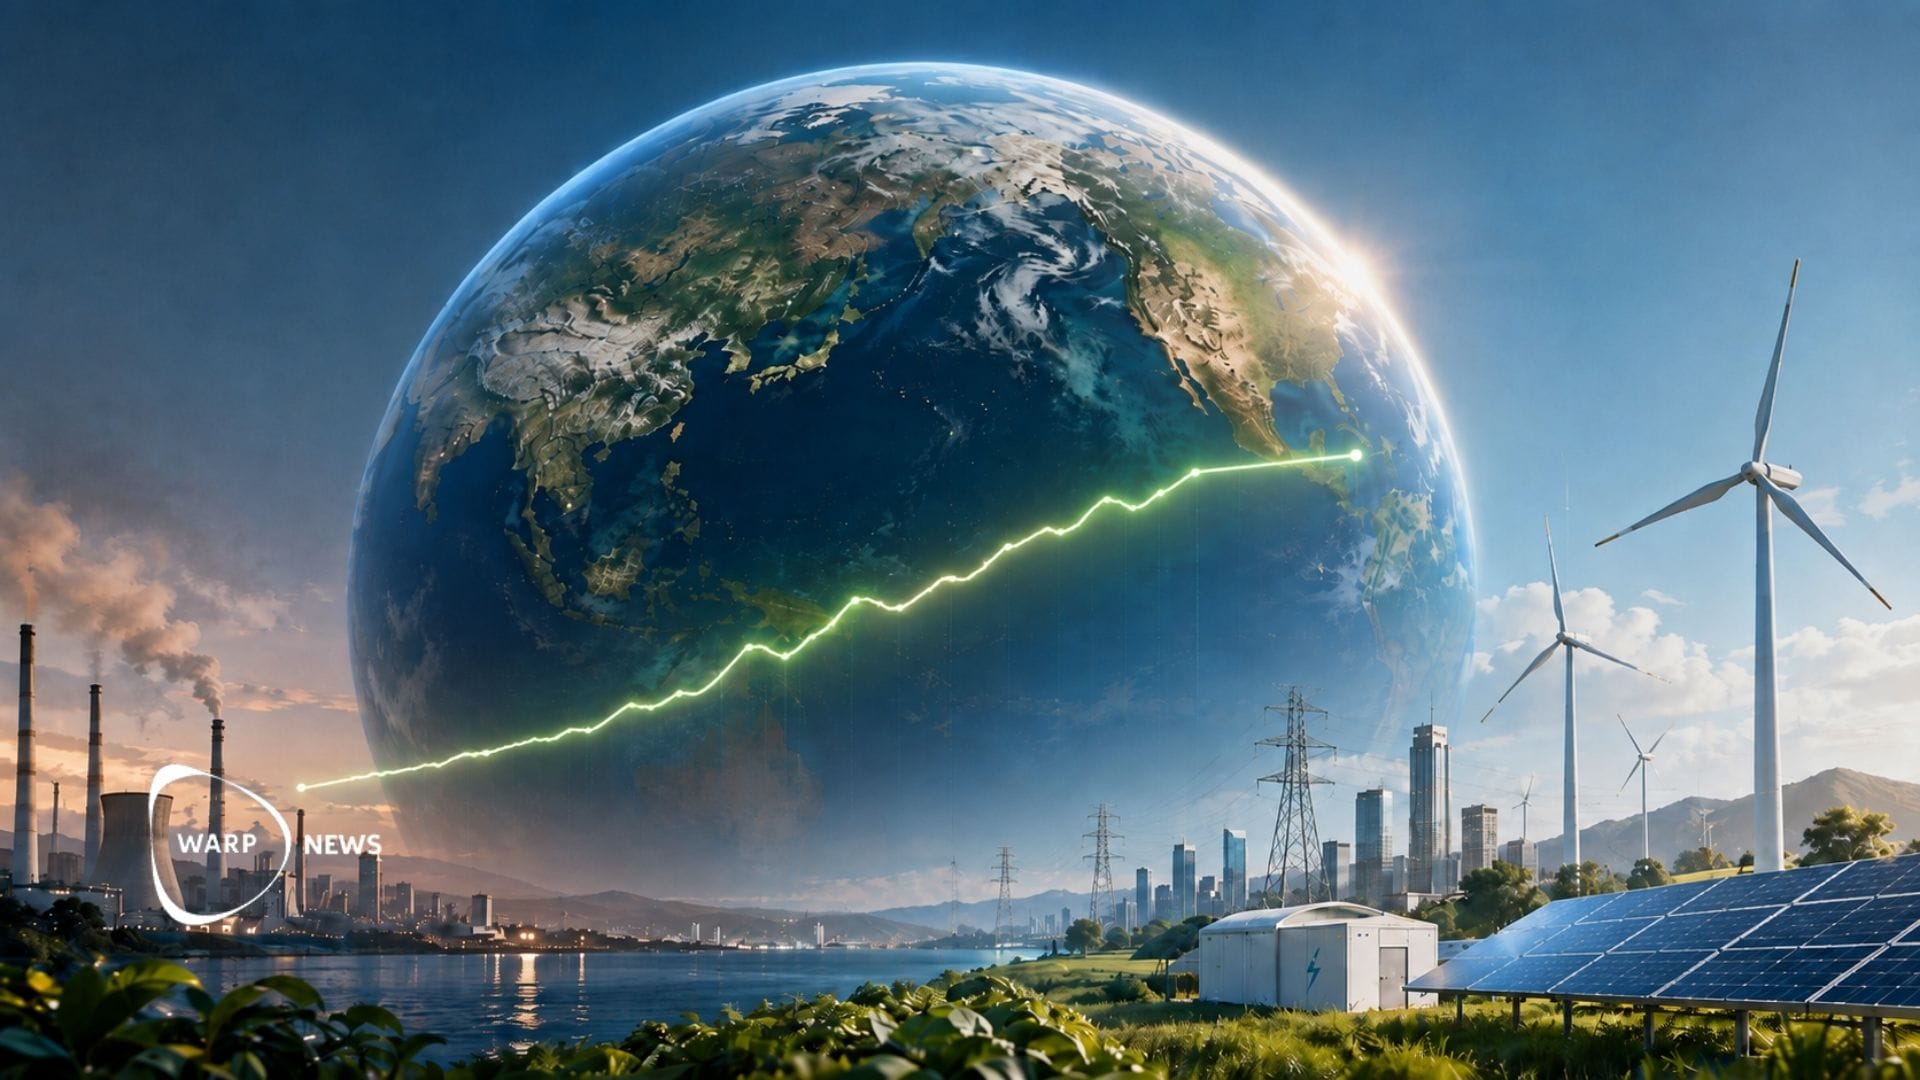
🌏 Global greenhouse gas emissions have almost stopped growing
Emissions rose 0.2 percent compared with the first half of 2025. Between 2015 and 2023, they grew by an average of 1.1 percent per year. China and the United States, the world's two largest emitters, saw their emissions fall by 0.3 and 0.4 percent respectively.

🤑 New research: Freer economies grew without harming the environment
A study of 49 economic liberalizations shows that GDP per person rose 16 percent within ten years. Total greenhouse gas emissions did not increase, and deaths from air pollution declined. After the year 2000, emissions fell both per person and per dollar of economic output.
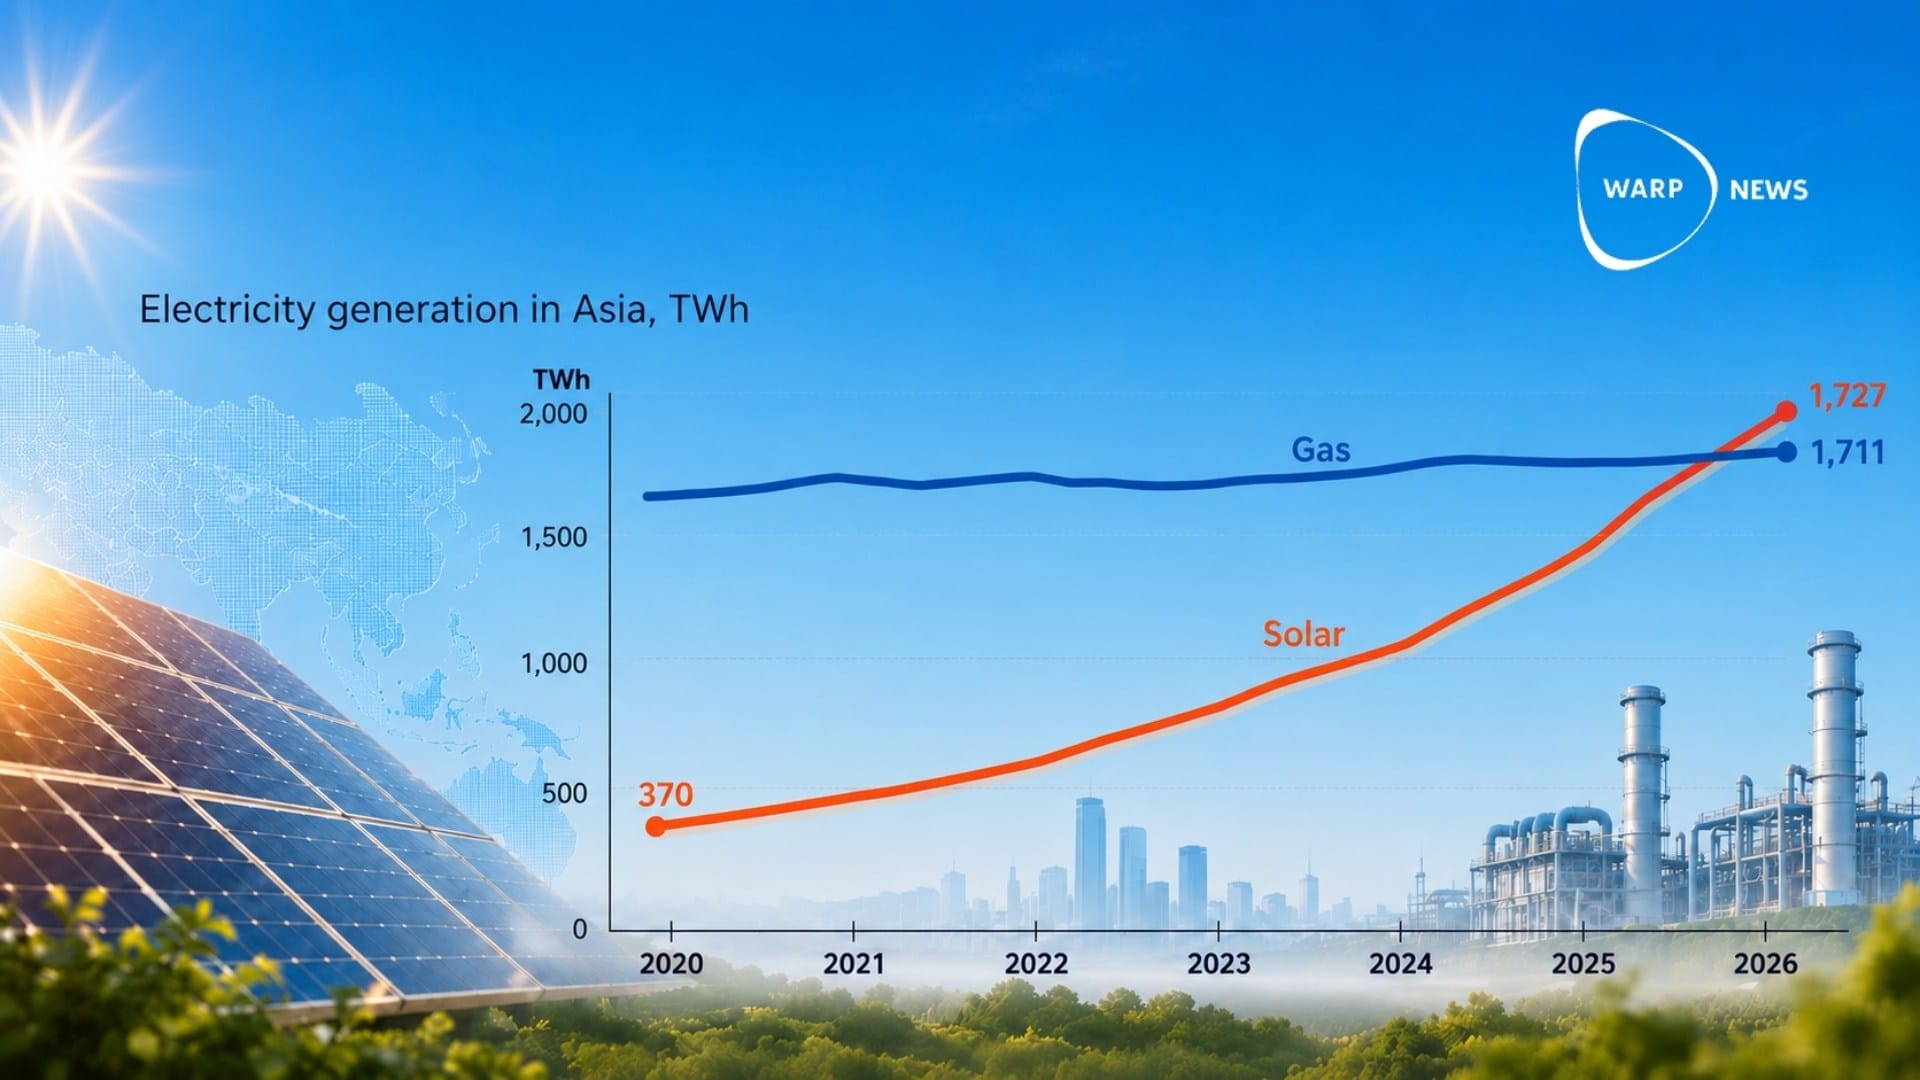
☀️ Solar overtakes gas in Asia
Solar power has surpassed gas to become Asia’s third-largest source of electricity. Solar generation in Asia has nearly quadrupled since 2020, reaching 1,727 terawatt hours over the twelve months to April 2026.
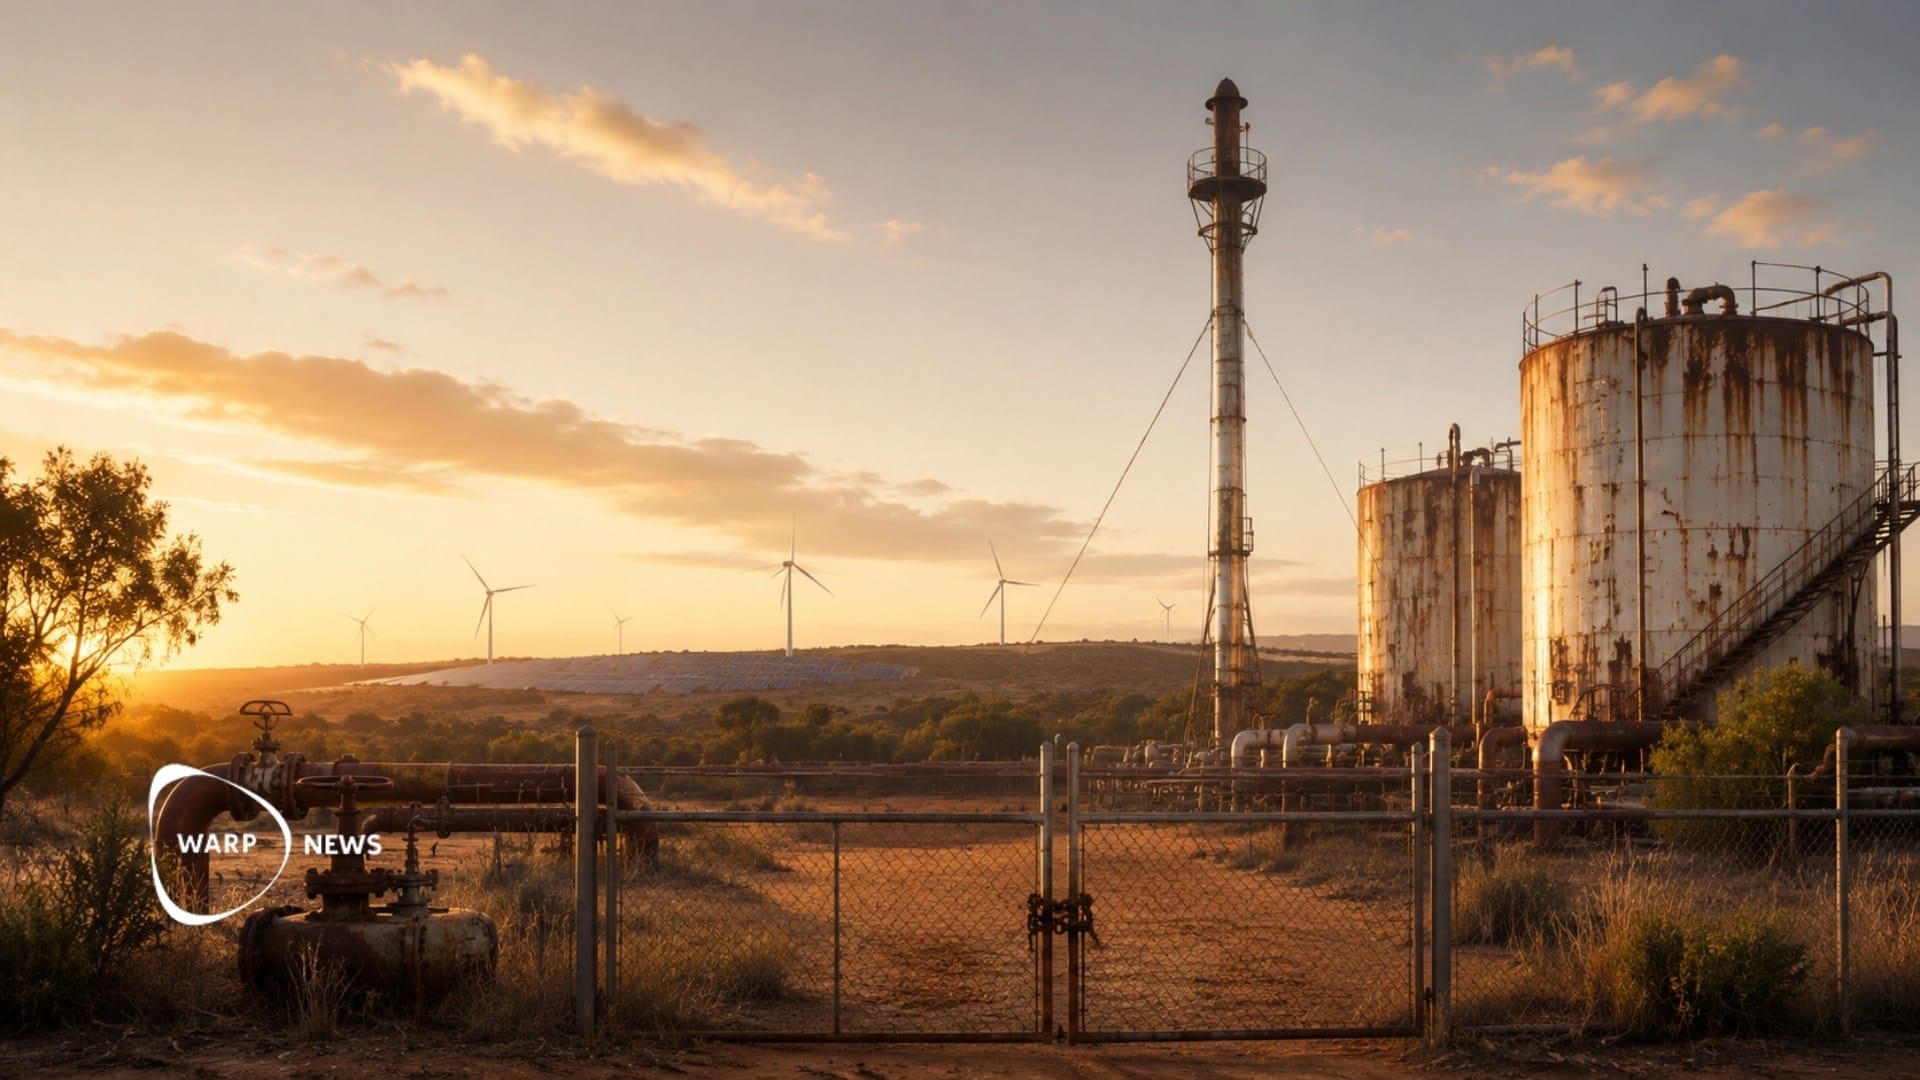
📉 Australia's gas use has peaked and is now declining
Gas use in Australia has peaked across all sectors after more than half a century of growth. Gas for electricity generation has fallen 11 percent since 2014, and residential gas use peaked in 2020.

💰 EU cut emissions by 17 percent in a decade while the economy grew just as much
The EU's greenhouse gas emissions were 17.2 percent lower in 2025 than in 2015. Over the same period, the EU's GDP rose by 17.5 percent. Emissions fell in 23 of the EU's 27 countries.

🌡️ Research committee that provides input to the IPCC drops the worst climate scenarios
The research committee ScenarioMIP, which develops the climate scenarios that form the basis for the IPCC's reports, has officially classified the previous worst-case scenarios RCP8.5, SSP5-8.5 and SSP3-7.0 as implausible.
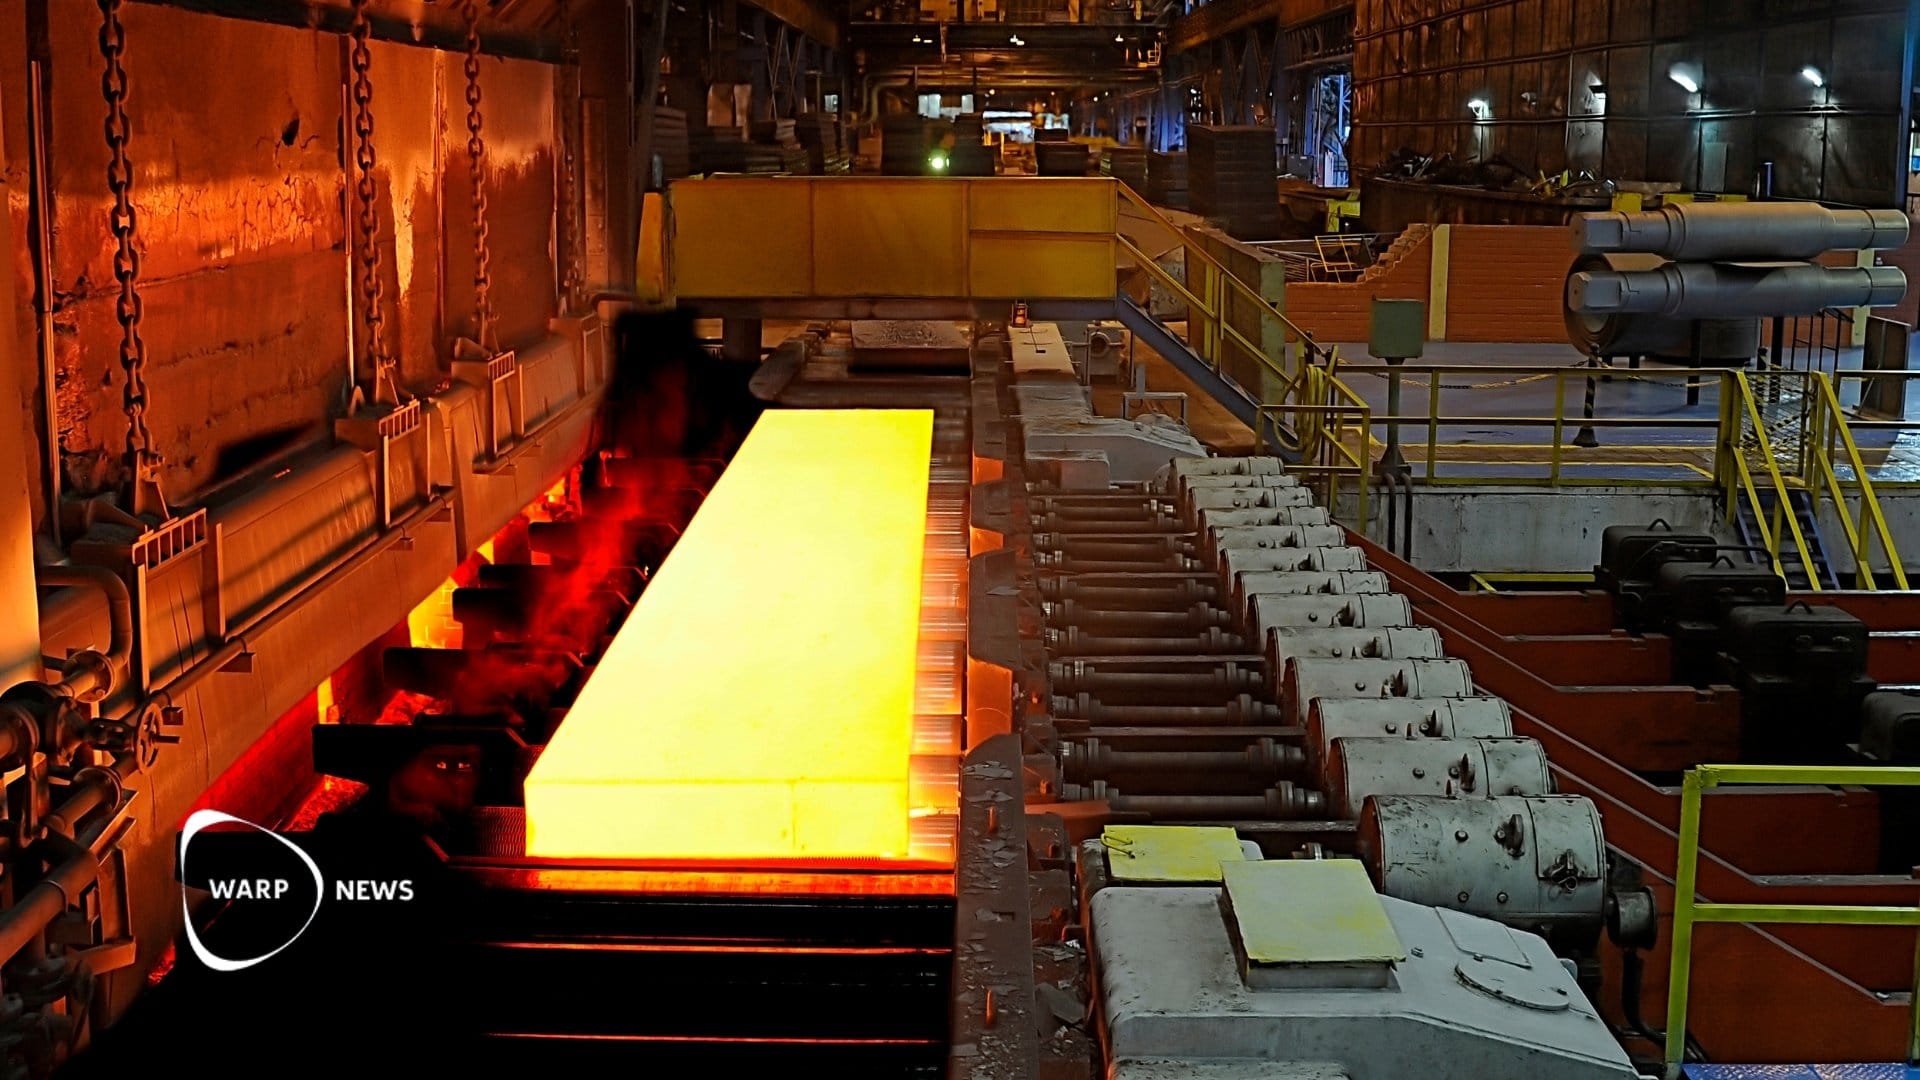
🏗️ More than 80 percent of China's steel production upgraded to ultra-low emissions
Emissions have already fallen by 34 million tonnes of CO2 – equivalent to permanently shutting down eight coal-fired power plants. The steel industry accounts for 7 percent of global emissions, and China produces more than half of the world's steel.
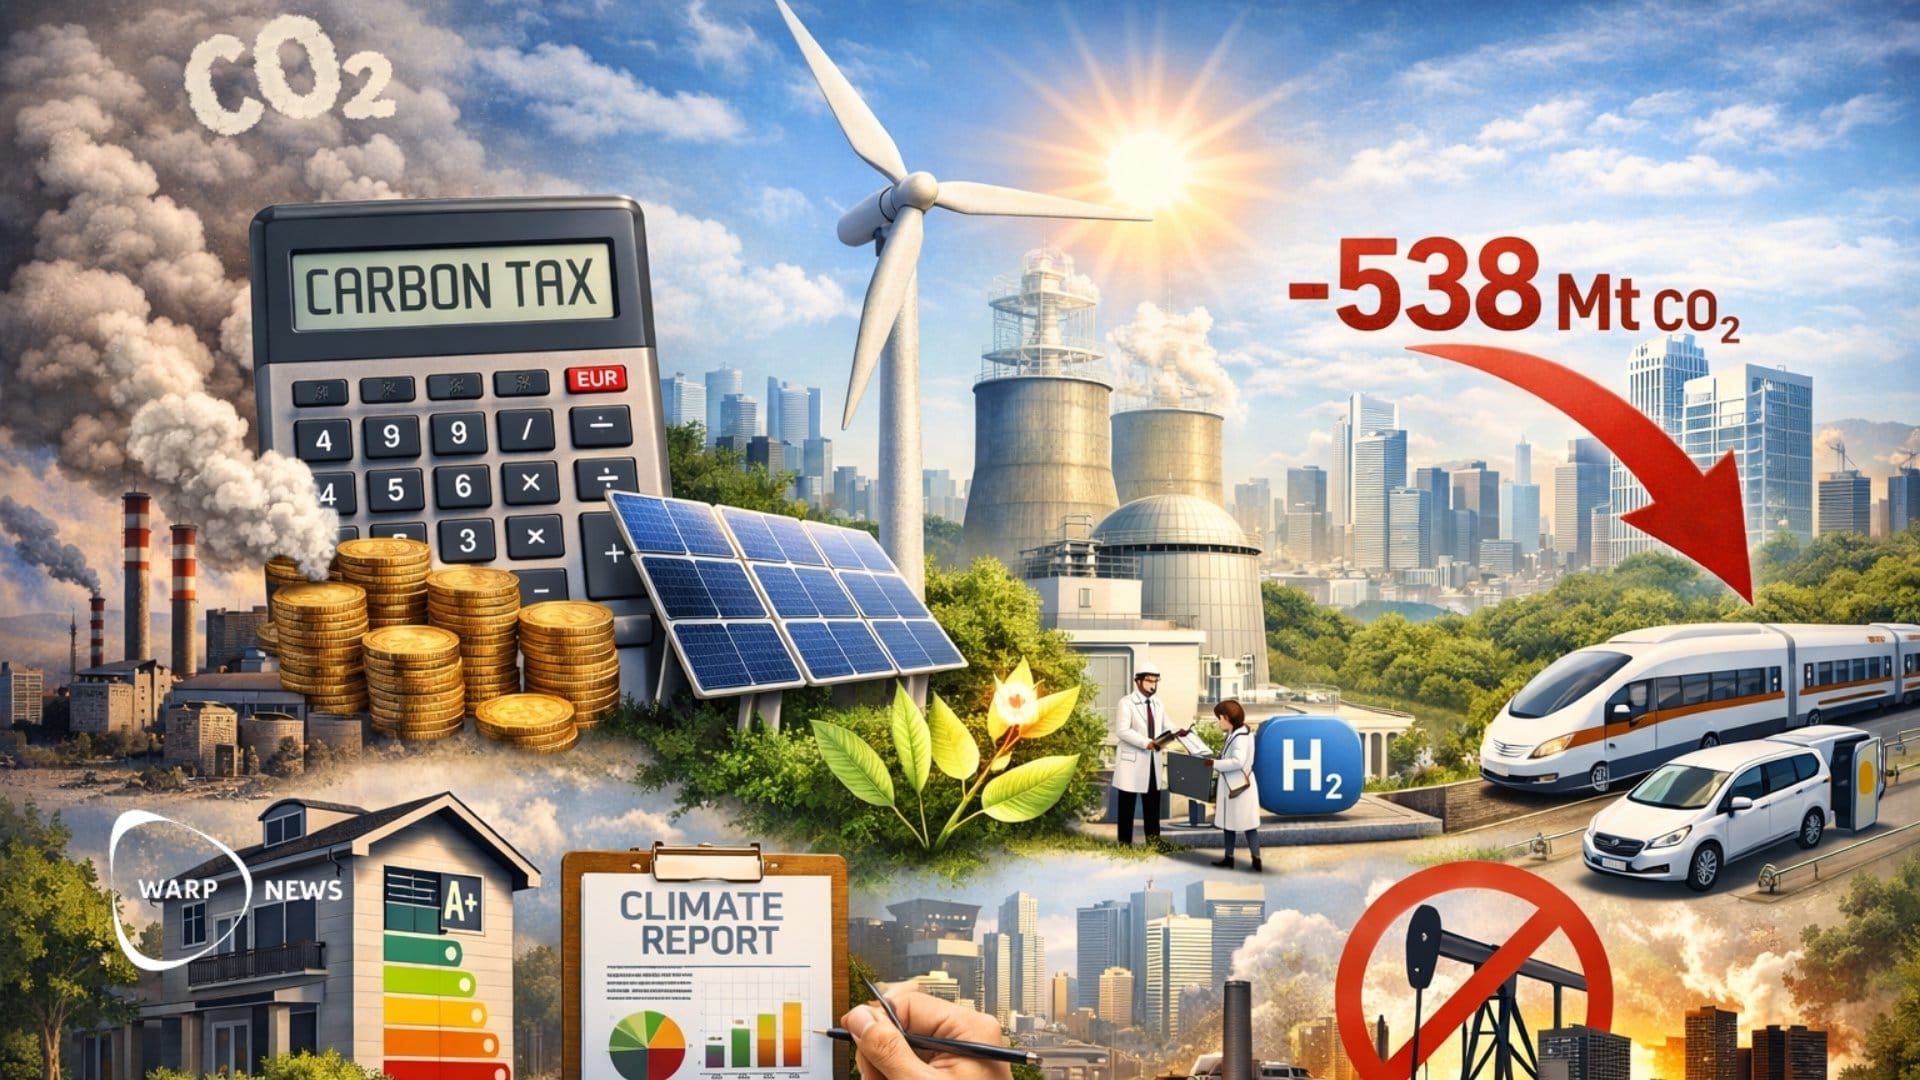
📑 Research identifies 28 climate policies that work in all countries
A study of 1,737 climate policies across 40 countries over 32 years shows which measures consistently reduce emissions regardless of context. Carbon taxes and investments in renewable energy and research stand out as particularly reliable instruments for reducing emissions.